
Which items has inflation impacted the most?
Experian inventories which expenses cost more than they did before prices began spiking during the pandemic.

There's the inflation you see, and then there's the inflation you feel. Put differently, while inflation is a perennial news item, it's not always as present in the daily lives of Americans as it has been in the years since the pandemic.
After more than four years of unprecedented swings in supply, production, and prices, consumers have both seen and felt inflation. While they have borne the added burdens of shortages and sharply rising prices, it's becoming clearer that prices for most things are returning, if not to normal, then to a new normal.
In this report, Experian will inventory which expenses—big and small, tangible and otherwise—cost more than they did before prices began spiking during the pandemic. To simplify the comparison, this inventory goes back five years to August 2019.
This report also examines the forces that have allowed consumers, by and large, to still afford these purchases despite some price increases of 30% or more compared to the end of the last decade.
The Bigger Picture
Starting from the top: There are a few major broad measures of inflation in the U.S. What gets most of the attention is the consumer price index, the so-called headline index, which measures the cost of goods for city consumers. That measure peaked at 9.1% in June 2022, back when quiet quitting and goblin mode (and for some, both) were topics of discussion, often over Zoom.
Core CPI vs. Volatile Price Changes
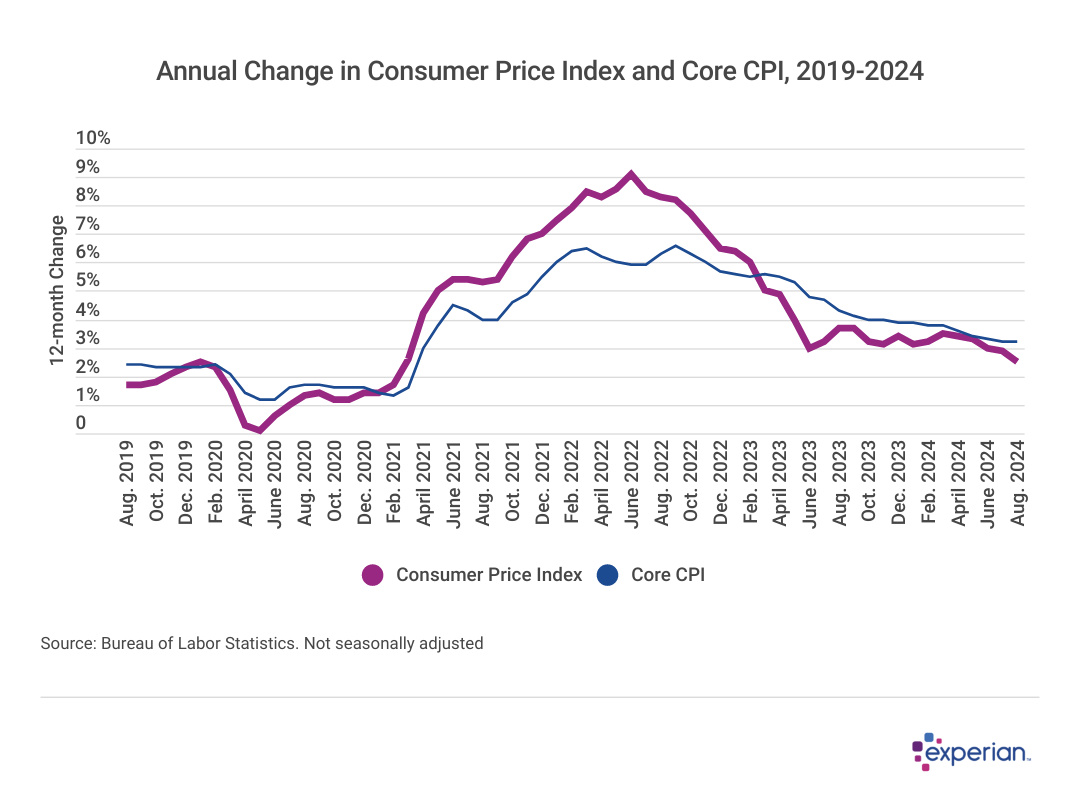
Core CPI, one of the Federal Reserve's preferred measures of observing inflation, strips out more volatile components of the consumer basket—namely, food and energy. Here's what those price changes looked like during the same period:
Key Price Shifts Since 2019
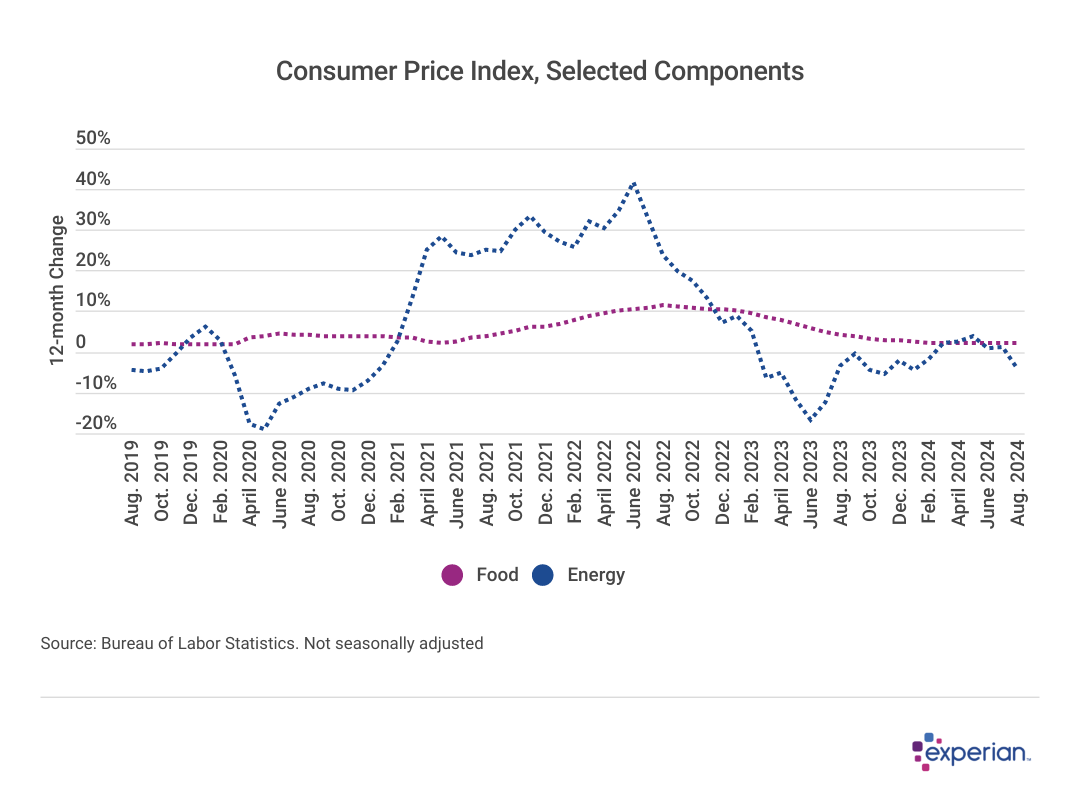
At its peak, food inflation was even higher than overall inflation, with an annual rate of 11.4% in August 2022. Energy price inflation peaked at an astonishing 41.6% just two months prior in June 2022. Energy prices also declined annually by double digits twice over the past five years.
But those are annual rates, and this report looks for change starting in 2019. Here are the price changes for selected categories over the past five years.
Rising Costs of Essential Consumer Goods Since 2019
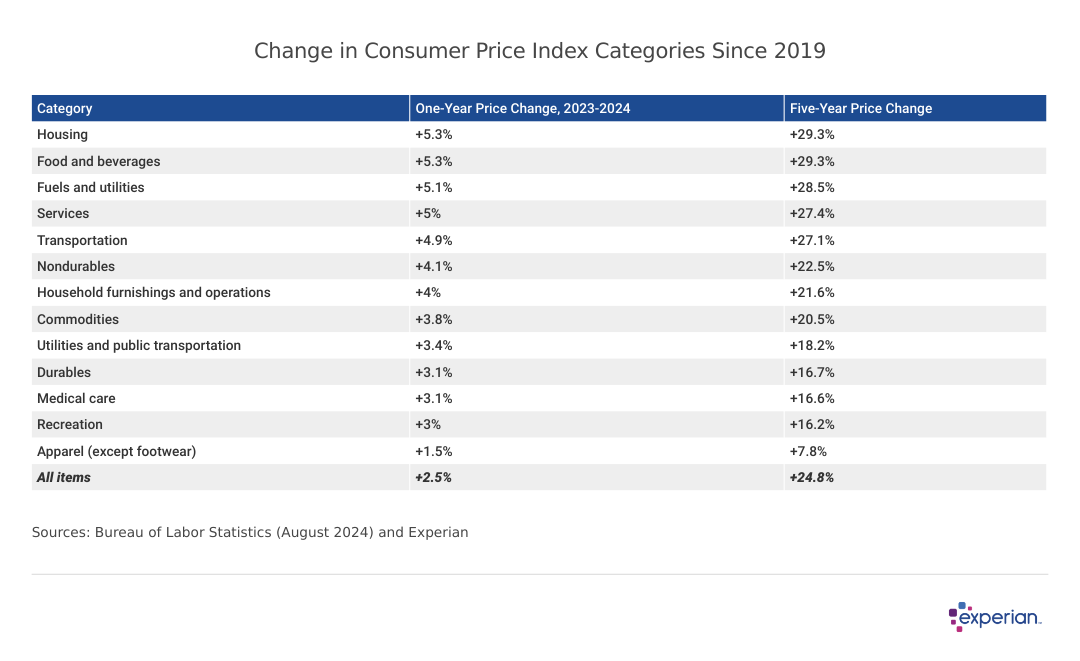
Broadly speaking, consumer expenditures cost roughly 25% to 30% more than they did five years ago, with the basics experiencing the biggest cost increases: Housing, food and energy have increased more than other categories since 2019, albeit slightly.
The Little Purchases That Make Big Impressions
That's partly because volatile components like eggs and gasoline—the same items central bankers find so distracting when deciding interest rate policy—are the prices consumers may see multiple times per week, as opposed to goods bought less frequently, if at all. Not everyone needs lawn care equipment and supplies, but food is a universal expense.
Furthermore, these items with larger price swings make up more than one-fifth of a typical consumer basket, according to Bureau of Labor Statistics weightings. Food is 14% in 2024, while energy costs make up 7% of a typical consumer's overall spending.
Particular items in the food and energy baskets feature prominently among the consumer goods or services that increased the most in price over the past five years, just as the category leads. Of the more than 200 items the Bureau of Labor Statistics tracks the prices of every month, these are the 10 that increased the most.
Note: In the table below, "relative importance" measures how consumers react to changes in an item's price. Most consumers, for instance, probably wouldn't change how much oregano they buy, even if prices doubled. They may change their habits if it were gasoline, however.
Increased Vehicle Expenses, Decreased Electronics Prices Since 2019
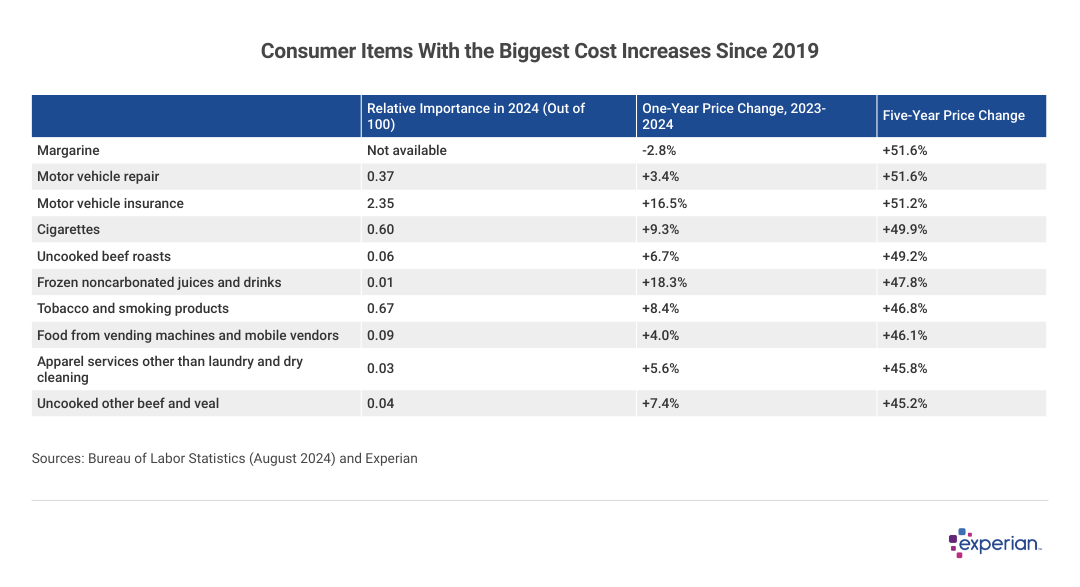
Most consumers will likely find a way to substitute for exorbitant margarine prices; it's the price increases of some of the other items that cause more concern. Ancillary motor vehicle costs—so-called hidden costs like car insurance and vehicle repair—make up 3% of the typical consumer's total expenditure and have increased in price by an average of more than 50% since 2019.
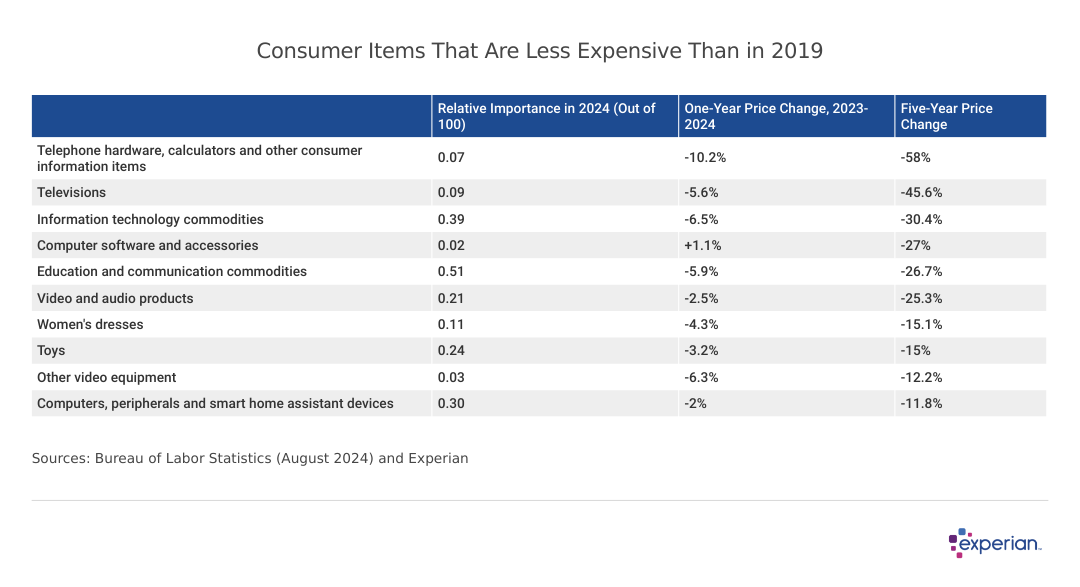
And, in the spirit of fairness, plenty of items have actually fallen in price since 2019, though not many that are likely a big part of anyone's annual budget. Electronics, as is often the case, fall in price as gadgets age and are replaced by more expensive next-generation equipment scooped up by early adopters.
The Real Deal: Is Income Keeping Up?
By some measures of wages, income has kept up with inflation on consumer goods. For others, not as much. Overall, nominal wages have increased by 34% since 2019, which is more than the broad price increases consumers have experienced over the same period.
But those wage increases aren't as evenly distributed among workers, just as some consumers are more impacted by inflation than others. Consumers with lower-than-average wages are actually earning even more than the 34% nominal jump, while those with average and above average wages prior to the pandemic aren't seeing their wages keep up with inflation.
The Case of the Missing Home Insurance Premiums
If it seems like something is missing in this discussion, it's true. Accounting for home ownership costs, especially when it comes to measuring inflation, is far from straightforward. One problem among a few: How does one reconcile homeowner costs with those of renters, for instance? (The Bureau of Labor Statistics has much, much more on owners' equivalent rent than this report can succinctly encapsulate.)
Further complicating the governmental accounting of inflation: Home insurance premiums are not included in the consumer price basket. (There's the "tenants' and household insurance" category, but that only counts certain condominium or renters insurance when measuring price changes, not home insurance as it applies to most one- to four-unit residences in the U.S.)
Recent reporting by Bloomberg Intelligence suggests that home insurance, if included, would increase consumer inflation by more than half a percentage point than the current CPI rate of 2.5%.
The Higher Price of Credit
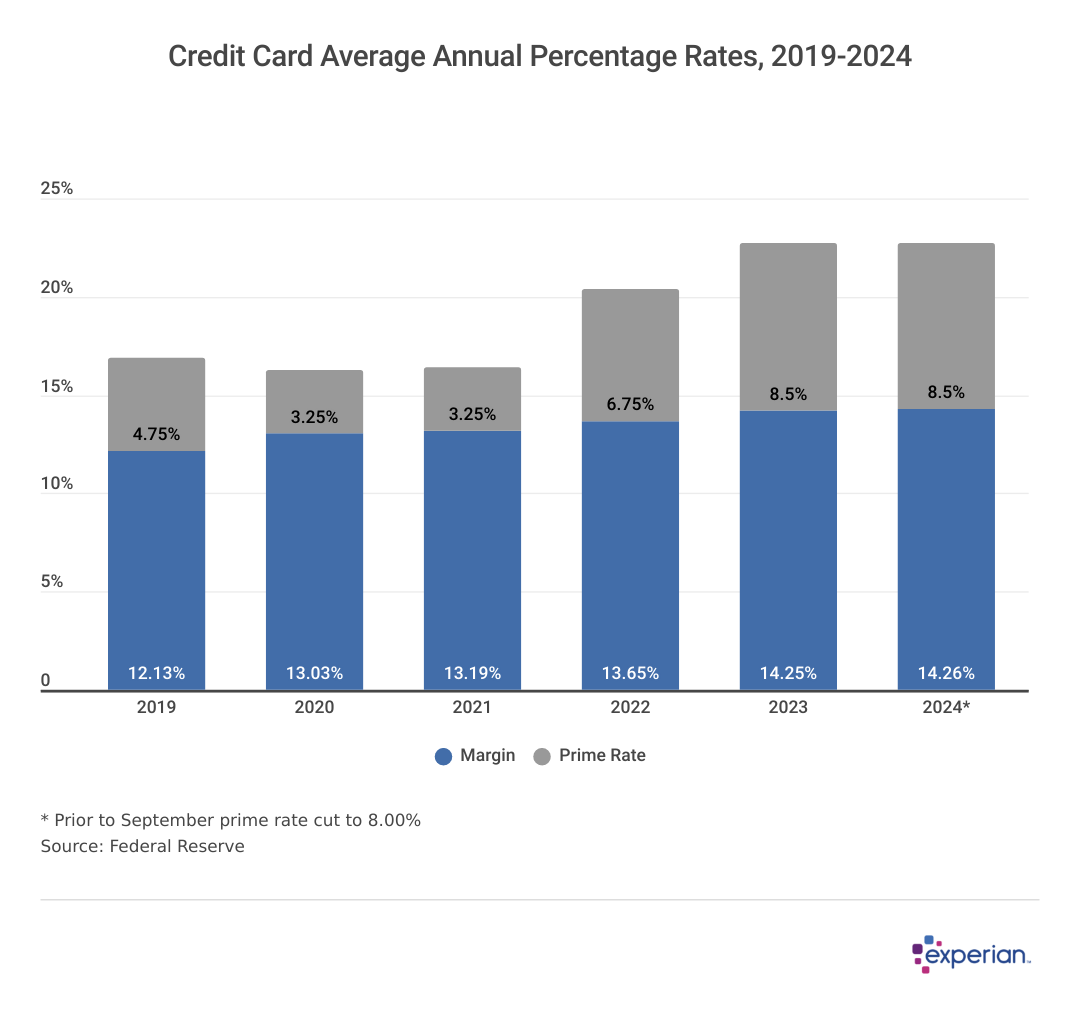
Many consumers are using credit, primarily credit cards, to manage whichever particular price increases are hitting them the hardest. Due to climbing revolving balances and higher APRs, consumers paid more than $120 billion in interest on the portion of the more than $1 trillion in total credit card balances that are carried from one month to the next.
When the Federal Reserve raises or lowers its rates, credit card issuers follow suit. That's because nearly all variable-rate credit cards track the prime rate, which has echoed the federal funds rate for decades. So when the interest rates for both climbed by more than five percentage points since 2021, interest payments increased sharply. The inverse is true as well.
With one Fed rate cut already implemented and more expected before year's end, consumers carrying credit card balances should get some relief, but credit card interest rates are likely to remain above pre-pandemic levels for the time being.
This story was produced by Experian and reviewed and distributed by Stacker Media.